utils

Java: pretty print data structures

Java lacks functionality to pretty print data structures. Let’s remedy that situation.

To make that work we will use code from some other posts : [Is scalar], [join], [List to Map].

It is simple recursive function : dump()

Below you can see an example usage.

You can also experiment with the code here.

import java.util.*;
import java.util.Map.Entry;

class Dump {
  
  	//the biggest invention in Java-world since sliced-bread ;)
	public static <ARG> void say(ARG arg) { System.out.println(arg); }

        //joins Iterable or Collection into a String
	public static <T> String join(String delimiter, Iterable<T> lst) {
		StringBuilder str = new StringBuilder();
		Iterator<T> it = lst.iterator();
		while ( it.hasNext() ) {
			str.append(it.next().toString());
			if (it.hasNext()) str.append(delimiter);
		}
		return str.toString();
	}

  	//for Classes check if the value is SCALAR
	public static boolean is_scalar(Object var) {
	    if( (var instanceof Number) || (var instanceof String) || (var instanceof Boolean)) return true;
	    return false;
	}


	public static HashMap<Integer, ?> list2map(List lst) {
		HashMap map = new HashMap();
		for (int i=0; i < lst.size(); i++) {
			map.put(i, lst.get(i));
		}
		return map;
	}	
	
	public static String dump(List lst, String... offset) {
		return dump(list2map(lst), offset);
	}
	
	// Pretty print a LoL structure, for debugging purposes
	public static String dump(Map m, String... offset) {
		if (m == null) return "";
	    StringBuilder rv = new StringBuilder();
	    String delta = offset.length == 0 ? "" : offset[0];
	    for( Entry e : (Set<Map.Entry>) m.entrySet() ) {
	        rv.append( delta + e.getKey() + " : " );
	        Object value = e.getValue();
	        if( value instanceof Map ) rv.append( ">\n" + dump((Map) value, delta + "  ") ); 
	        if( value instanceof Collection ) rv.append( "[" + join(",", (Collection) value) + "]\n" );
	        if( is_scalar(value) ) rv.append( value +"\n" );
	    } 
	    return rv.toString();
	}
	
	public static void main(String[] args) {
		  
      List lst = Arrays.asList(1,2,3,4);
      HashMap lvl2 = new HashMap() {{
       put("key2-1", "value2-1");
       put("key2-2", "value2-2");
      }};
      
      
      HashMap map = new HashMap() {{
       put("key", "value");
       put("lvl2", lvl2);
       put("lst",lst);
      }};
      
      
      say(dump(map));
	}
	
}	

here is the output :

lvl2 : >
  key2-2 : value2-2
  key2-1 : value2-1
lst : [1,2,3,4]
key : value

HashList for key:value pairs

In Prolog if you need to use hashes you can use Dicts, but for small number of kv-pairs it is overkill.

In such cases use the HashList that I invented ;). It is very easy and you can use it as a Two way hash too. Very handy.

% HashList utils : [ key1:val1, key2:val2, ... ], also can be used as TwoWaysHash
keys(HL,Res) :- maplist(\I^K^(I = K:_),HL,Res).
vals(HL,Res) :- maplist(\I^V^(I = _:V),HL,Res).
val(Key,HL,Res) :- member(Key:Res,HL).
key(Val,HL,Res) :- member(Res:Val,HL).

-----

?- use_module(library(lambda)).

?- H = [first:john, last:doe, city:huston, state:tx],
keys(H,Keys),vals(H,Vals),
val(city,H,Val),key(huston,H,Key).

H = [first:john, last:doe, city:huston, state:tx],
Keys = [first, last, city, state],
Vals = [john, doe, huston, tx],
Val = huston,
Key = city .

Calculating Moving (Average) ++

If you have time series data and want to calculate Moving-function like Moving Average you can use a Rolling window like shown below … enjoy

import numpy as np

def rolling_window(a, window):
    shape = a.shape[:-1] + (a.shape[-1] - window + 1, window)
    strides = a.strides + (a.strides[-1],)
    return np.lib.stride_tricks.as_strided(a, shape=shape, strides=strides)

a = np.arange(0,10)

print(rolling_window(a,5))

print(np.mean(rolling_window(a,5), axis=1))

-----
[[0 1 2 3 4]
 [1 2 3 4 5]
 [2 3 4 5 6]
 [3 4 5 6 7]
 [4 5 6 7 8]
 [5 6 7 8 9]]

[2. 3. 4. 5. 6. 7.]


b = np.random.randint(0,100,10)

print(rolling_window(b,5))

print(np.mean(rolling_window(b,5), axis=1))

-----
[[42 93 30 69 53]
 [93 30 69 53 93]
 [30 69 53 93 61]
 [69 53 93 61 22]
 [53 93 61 22 53]
 [93 61 22 53 71]]

[57.4 67.6 61.2 59.6 56.4 60. ]

or here is another way to do moving average :

import numpy as np

def moving_average(a, n=3) :
    ret = np.cumsum(a, dtype=float)
    ret[n:] = ret[n:] - ret[:-n]
    return ret[n - 1:] / n

print(moving_average([1,2,3,4,5,4,3,2,1]))

-------

[2.0 3.0 4.0 4.33 4.0 3.0 2.0]

Get the size of data structures in Python

If you want to find or measure the size of memory a data structure or objects occupies, try the function below.

import sys
    
def get_size(obj, seen=None):
    """Recursively finds size of objects"""
    size = sys.getsizeof(obj)
    if seen is None:
        seen = set()
    obj_id = id(obj)
    if obj_id in seen:
        return 0
    # Important mark as seen *before* entering recursion to gracefully handle
    # self-referential objects
    seen.add(obj_id)
    if isinstance(obj, dict):
        size += sum([get_size(v, seen) for v in obj.values()])
        size += sum([get_size(k, seen) for k in obj.keys()])
    elif hasattr(obj, '__dict__'):
        size += get_size(obj.__dict__, seen)
    elif hasattr(obj, '__iter__') and not isinstance(obj, (str, bytes, bytearray)):
        size += sum([get_size(i, seen) for i in obj])
    return size
    

print(get_size(list(range(100))))
print(get_size(list(range(1000))))
print(get_size([[ i for i in range(10)] for j in range(100)]))
print(get_size([[ i for i in range(100)] for j in range(10)]))


-----
3804
37108
20388
12108

Easy way to calculate summaries

If you want to calculate totals or summaries of data stored in Array, you can use JavaScript functional style capabilities, namely .reduce().

Just create your summary function like this :

//lambda syntax
const isum = (acc,val) => acc + val
function izeros(acc,val) { return val == 0 ? acc + 1 : acc}
function inon_zeros(acc,val) { return val == 0 ? acc : acc + 1}

ary = [1,2,3,0,0,0,0]

console.log(ary.reduce(isum,0))
console.log(ary.reduce(izeros,0))
console.log(ary.reduce(inon_zeros,0))


----
Output:
6
4
3

You can try it here : https://onecompiler.com/javascript/3xjg9tyjt

Managing CSS colors with JavaScript

When you work with colors with JavaScript you have to use the rgb-format. But when you extract colors you get back the color as a string.

So I wrote several utility Functions to manage rgb colors.

function getbg(id) {// get background color
  let el = document.getElementById(id)
  let rgb = window.getComputedStyle(el).backgroundColor
  return rgb
}

function setbg(id,rgb) {// set background color
  let el = document.getElementById(id)
  el.style.backgroundColor = rgb
}

function rgb2ary(rgb_str) {
  return rgb_str.substring(4,rgb_str.length - 1).split(/,\s*/).map(a => Number(a))
}

function ary2rgb(ary){ return 'rgb(' + ary.join(',') + ')' }

function rand3() {
  return Array.from({length:3}, (_,x) => Math.floor(Math.random() * 255))
}

function rand_rgb() {return ary2rgb(rand3())}

here are some examples of how to use them :

> rand3()
[251, 1, 161]

> rand_rgb()
'rgb(25,120,161)'

> rgb2ary(rand_rgb())
[240, 137, 194]

> ary2rgb(rgb2ary(rand_rgb()))
'rgb(66,165,150)'

> setbg('abc',rand_rgb())

> getbg('abc')
'rgb(78, 43, 152)'

Linux tops

With this post I’m starting a series on general and sysadmin tools for Linux.

top

top is original process viewer/monitoring tool. Provides information about system resources.

As you can see from the screenshot below it provides :

  • PR : process priority
  • %CPU usage
  • %MEM : memory usage (RES)
  • SHR : shared
  • RES : resident memory
  • VIRT : virtual memory
  • TIME : Total CPU time the task has used since it started.
  • COMMAND

Also in the header it display summary information.

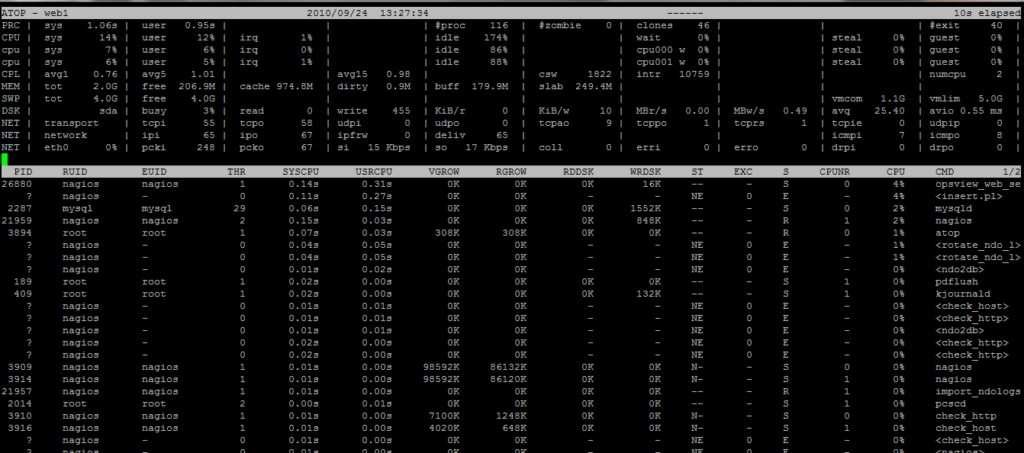
atop

The program atop is an interactive monitor to view the load on a Linux system. It shows the occupation of the most critical hardware resources (from a performance point of view) on system level, i.e. cpu, memory, disk and network.

The big difference with top is that atop collects accounting info even for processes that have already finished, you can debug not only immediate resource usage for short and long lives processes.

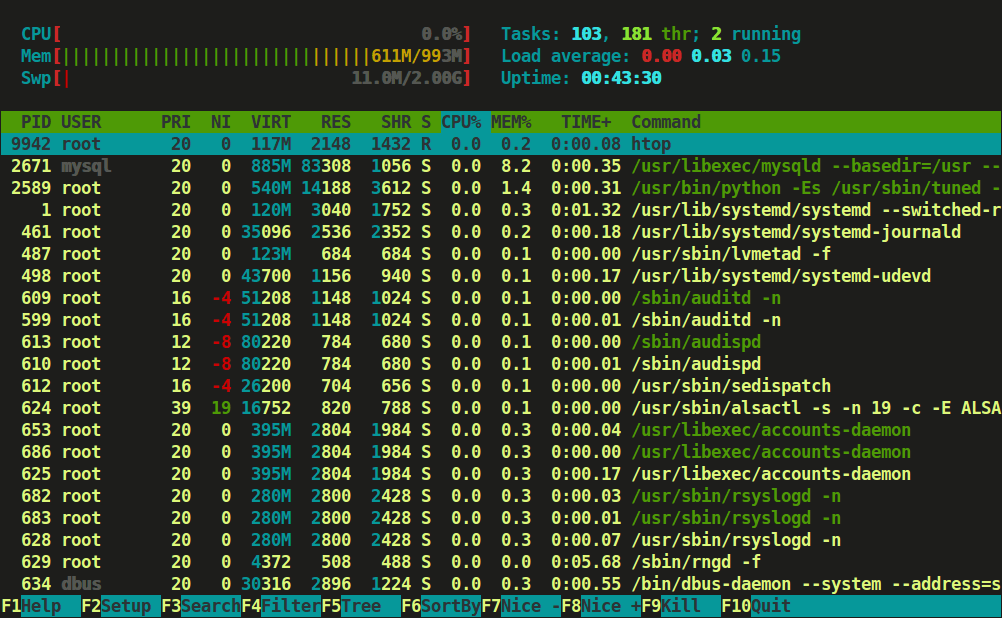
htop

htop is similar to top but is more interactive. You can scroll, search, explore and kill processes if needed.

Generate primes

Here are two Functions to generate prime numbers.

#generate primes in number range
def primes(start=1, end=100):
	rv = []
	for x in range(start, end+1) :
		for y in range(2,x) :
			if x % y == 0 : break
		else : rv.append(x)
	return rv

#generate n-primes starting from a number
def nprimes(start=1, cnt=100):
	rv = []
	x = start
	while len(rv) < cnt :
		for y in range(2,x) :
			if x % y == 0 : break
		else : rv.append(x)
		x += 1
	return rv

example :

: primes(0,100)                                                                                                                                                        
: [0, 1, 2, 3, 5, 7, 11, 13, 17, 19, 23, 29, 31, 37, 41, 43, 47, 53, 59, 61, 67, 71, 73, 79, 83, 89, 97]

: nprimes(0,10)                                                                                                                                                        
: [0, 1, 2, 3, 5, 7, 11, 13, 17, 19]

Easier print in Prolog

say(Lst) :- is_list(Lst), writeln(Lst).
say(S)   :- say(S,[]).
say(S,P) :- string_concat(S, '~n', S1), format(S1,P).

?- say('hello').
hello
true.

?- say('hello ~w',[world]).
hello world
true.

?- say('hello ~w ~w',[new,world]).
hello new world
true.

Check if value is SCALAR

//for Classes check if the value is SCALAR
public static boolean is_scalar(Object var) {
    if( (var instanceof Number) || (var instanceof String) || (var instanceof Boolean)) return true;
    return false;
}